Overview
MI Signals combines unique Market Insight B “dot” signals, multi-timeframe money flow and optional Market Insight A confirmation layers for robust, modular analysis and actionable trade signals.
Marketoolkit – MI Signals
Multi-Timeframe Trend & Signal Toolkit
Description:
Marketoolkit MI Signals is a custom-built, multi-timeframe analysis toolkit created to help you study price trends, momentum shifts and potential reversal points across your favorite markets.
All logic is original and combines unique Market Insight B “dot” signals, multi-timeframe money flow and optional Market Insight A confirmation layers.
This toolkit is designed for users who want to sharpen their technical analysis skills using a robust, modular system.
How to Use:
1. Choose Your Timeframe Pair
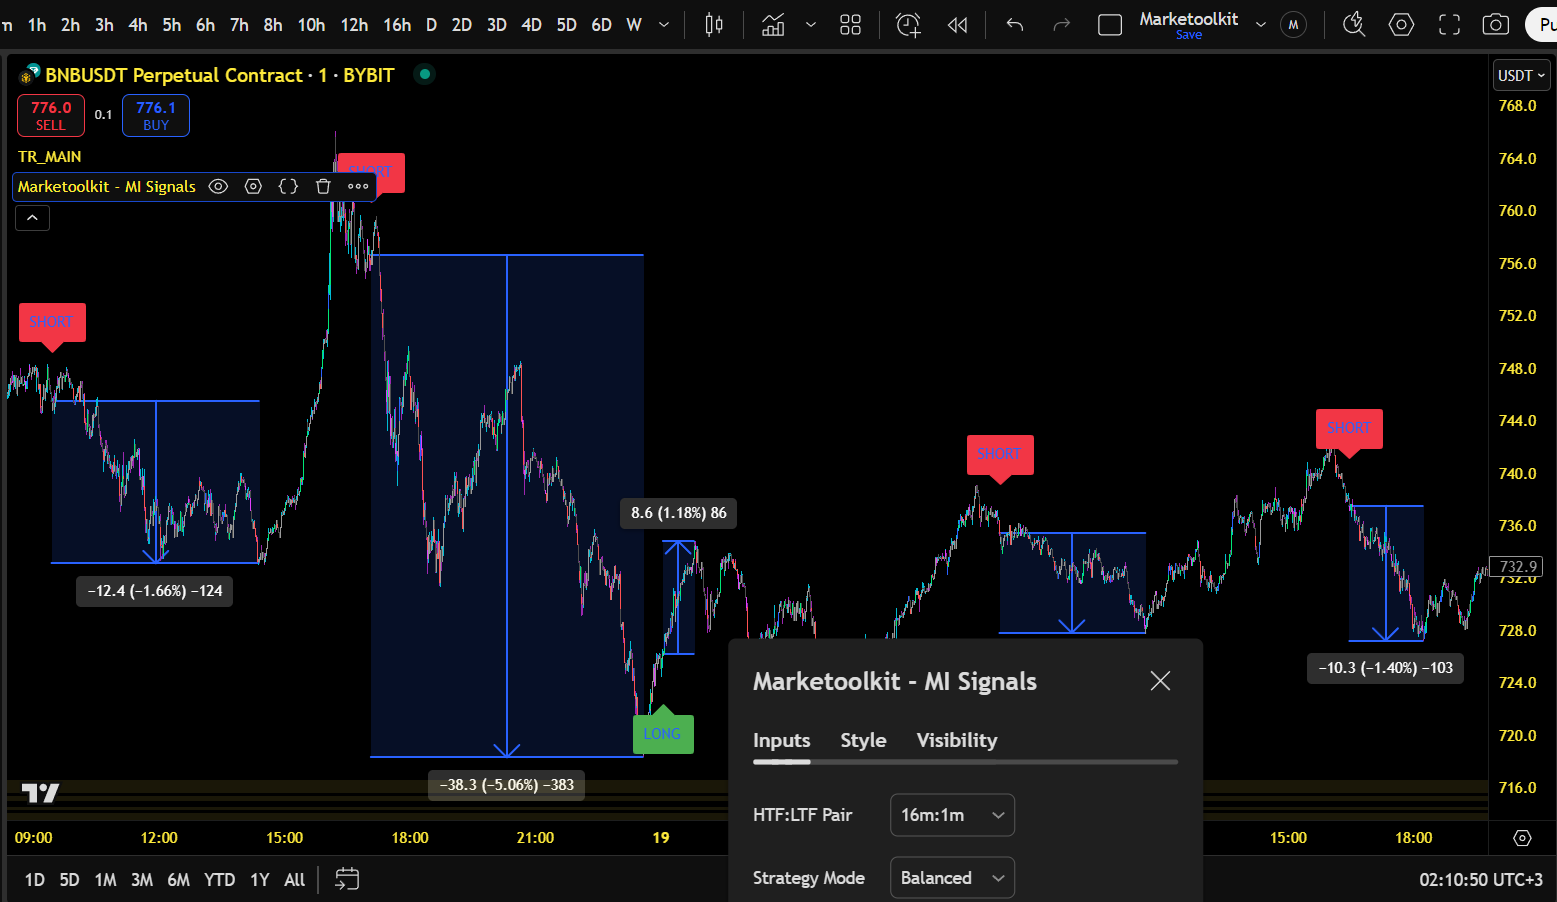
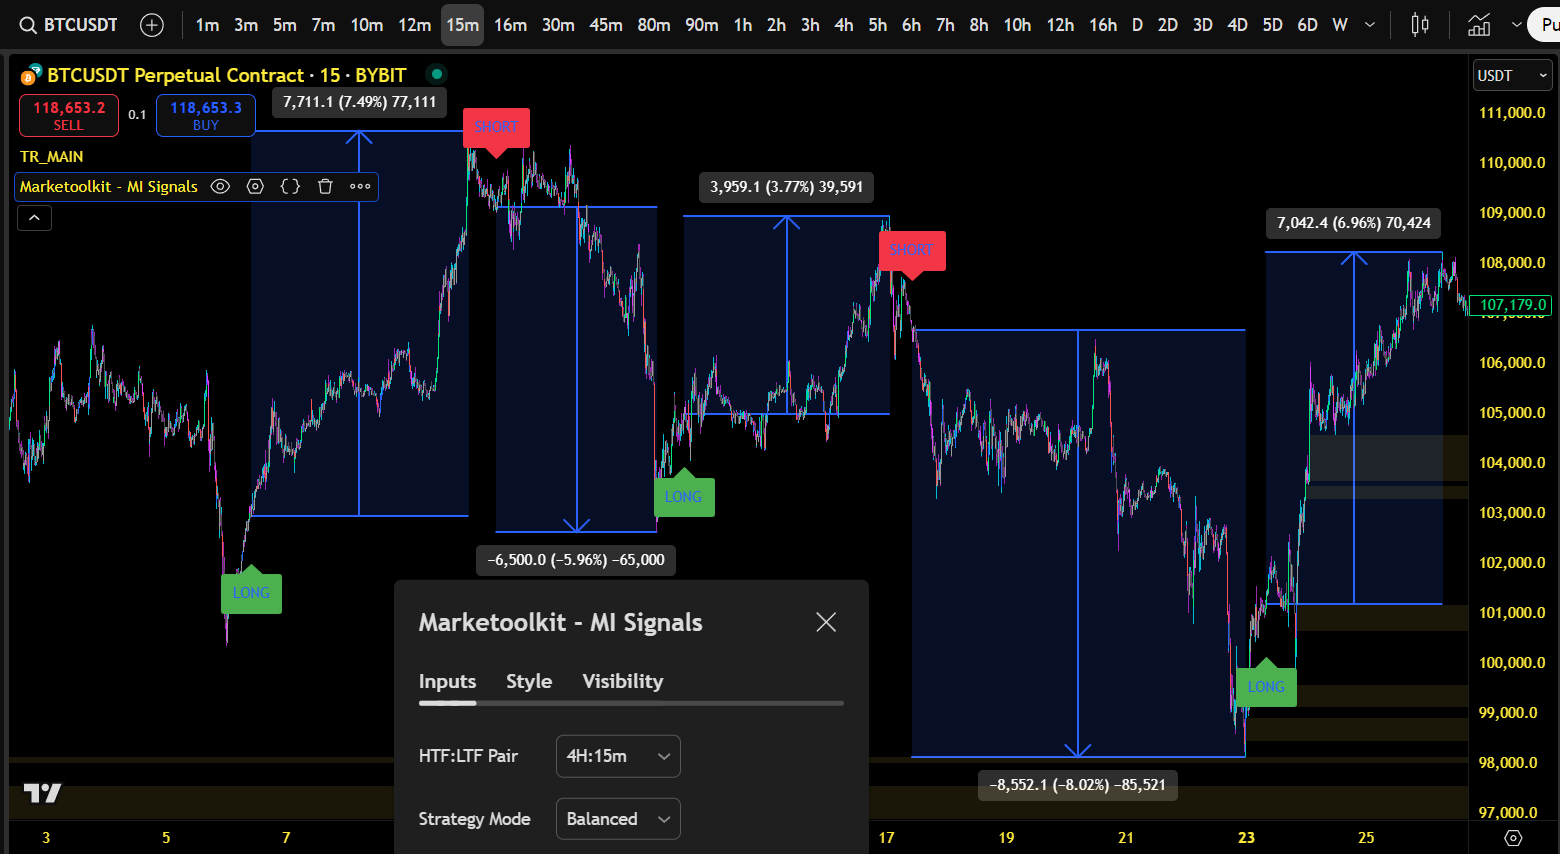
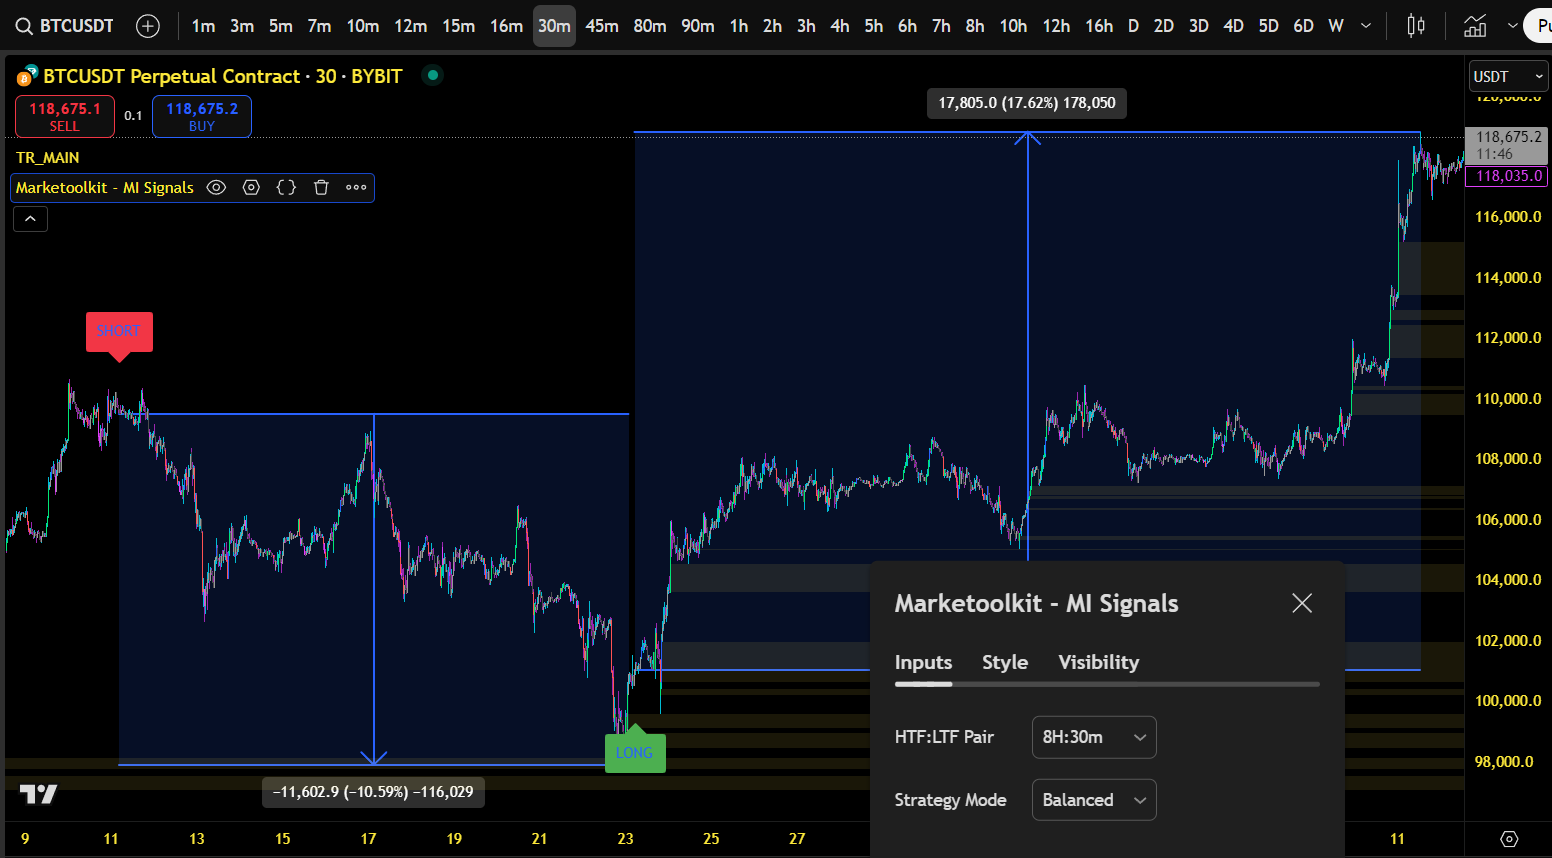
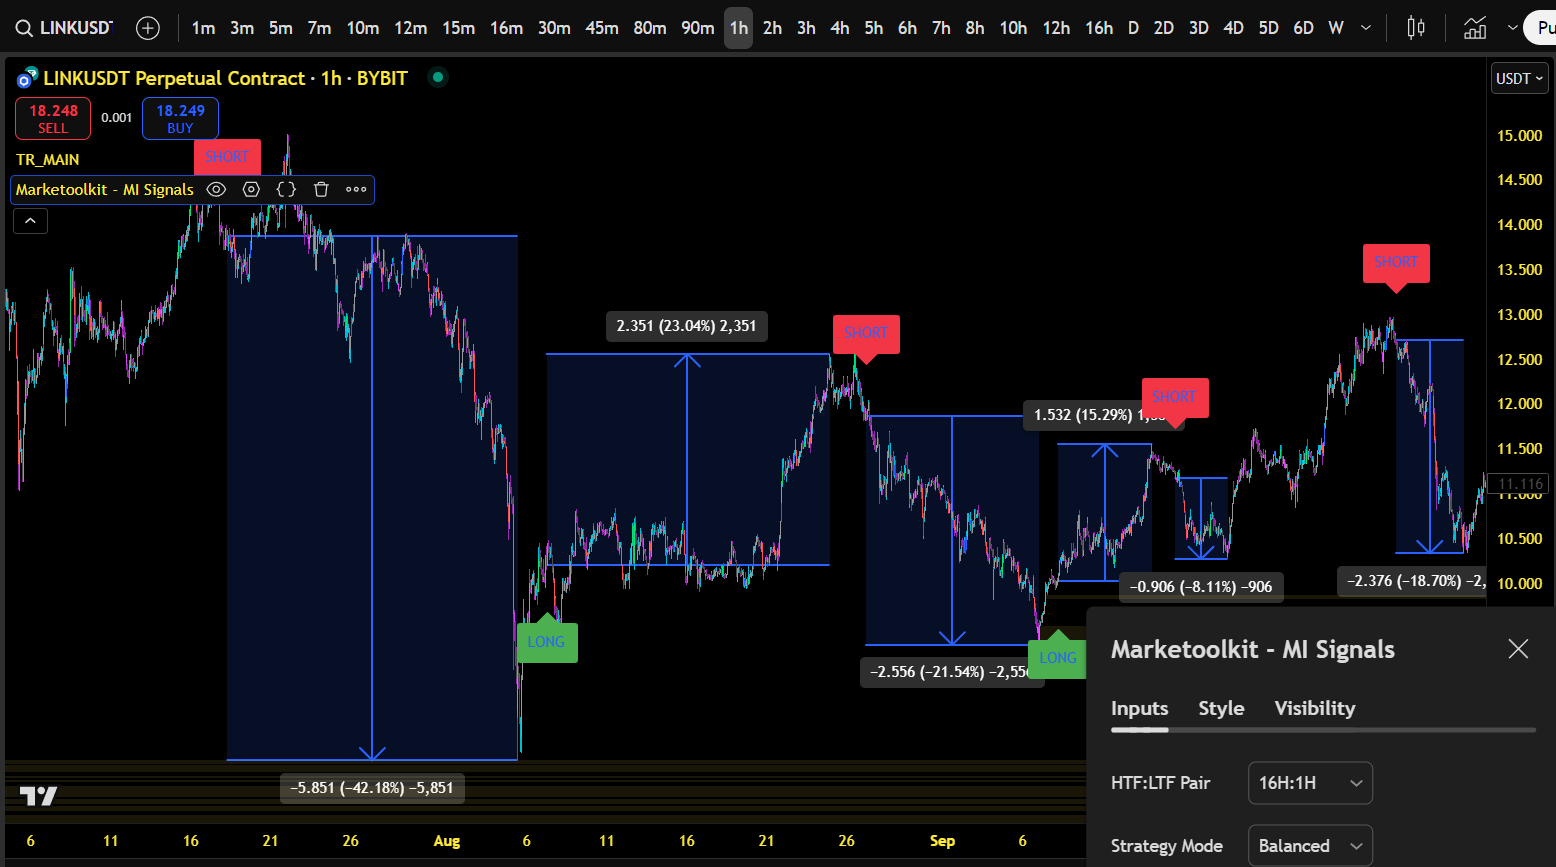
• In the settings, select your preferred combination of Higher Timeframe (HTF) and Lower Timeframe (LTF) pairs (e.g., 12H:45m, 4H:15m, etc.).
2. IMPORTANT: Set Your Chart to the LTF
• For correct operation, your TradingView chart must be set to the Lower Timeframe (LTF) from the pair you selected.
• Example: If you select “12H:45m,” set your chart to 45 minutes.
3. Pick Your Strategy Mode:
• Balanced: More frequent signals, waits for confirmation before each entry.
• Strict: Fewer, high-confidence signals, only triggers on new HTF bars.
• MarketInsightA: Adds advanced confirmation logic from our Market Insight A indicator (you can choose which signals to include).
4. Interpreting the Signals:
• Green “LONG” Label (below bar): Bullish signal; current trend and momentum align for potential upward movement.
• Red “SHORT” Label (above bar): Bearish signal; trend and momentum align for potential downward movement.
• No Label: No actionable signal
5. Add or Remove Confirmation Layers:
• In MarketInsightA mode, toggle specific confirmations to fit your analysis style.
Quick Reference: Market Insight A Default Signals Explained
These are the built-in confirmations used by default in MarketInsightA mode.
You can enable or disable any of them in the indicator settings:
• AlphaEmeraldEMA (bullish): Fast EMA crosses above slow EMA, often signals upward trend reversal.
• SapphireZenith (bullish): Secondary EMA cross, strengthens bullish momentum confirmation.
• BronzeTaurus Bar (bullish): Candle structure indicating sustained upward pressure.
• OmegaCrimsonEMA (bearish): Slow EMA crosses above fast EMA, potential downward reversal.
• Ruby Vector (bearish): Custom WaveTrend oscillator pattern indicating increased selling pressure.
• Scarlet Nexus X (bearish): Fast EMA crosses below reference EMA - confirms bearish momentum.
• Vermilion Surge (bearish): Rare event, combines Ruby Vector and Scarlet Nexus X for high conviction.
• Golden Pivot X (bearish): Advanced multi-indicator filter for extreme bearish conditions.
System Logic:
• The system monitors for special “dots” (trend shift markers from Market Insight B) on your chosen HTF.
• After a dot appears, the system waits for LTF money flow to confirm the direction.
• In MarketInsightA mode, further confirmation from Market Insight A’s default signals is required before triggering an entry.
• Alerts are available for both LONG and SHORT signals—perfect for paper trading, study, or notifications.
Part of the Marketoolkit Suite
• This indicator is part of the Marketoolkit suite, designed for advanced educational analysis.
• For best results, you can combine MI Signals with our other original tools: Market Insight A & Market Insight B
⚠️ Important Notice
This tool is provided for educational and informational purposes only. It is designed to assist in technical analysis learning and visual chart study.
It is not intended to be used as financial advice, a buy/sell signal, or any form of investment recommendation.
By using this indicator, you acknowledge that all actions you take are your own and you assume full responsibility for any decisions made.