Overview
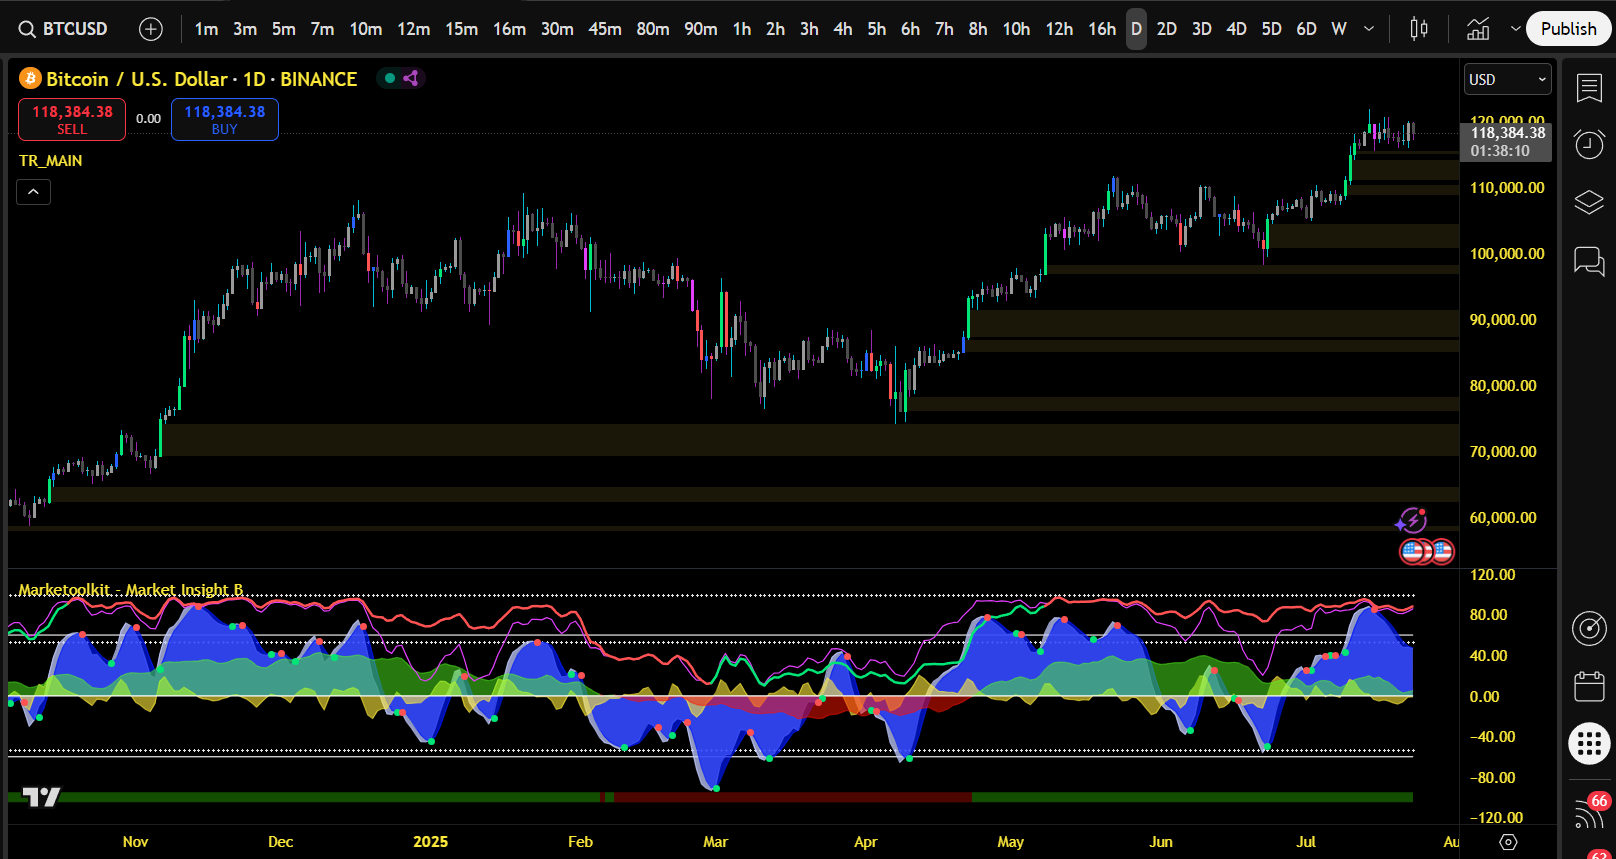
Market Insight B visualizes momentum shifts, trend pressure and money flow with color-coded signals and overlays, making it easy to spot reversals and trend exhaustion.
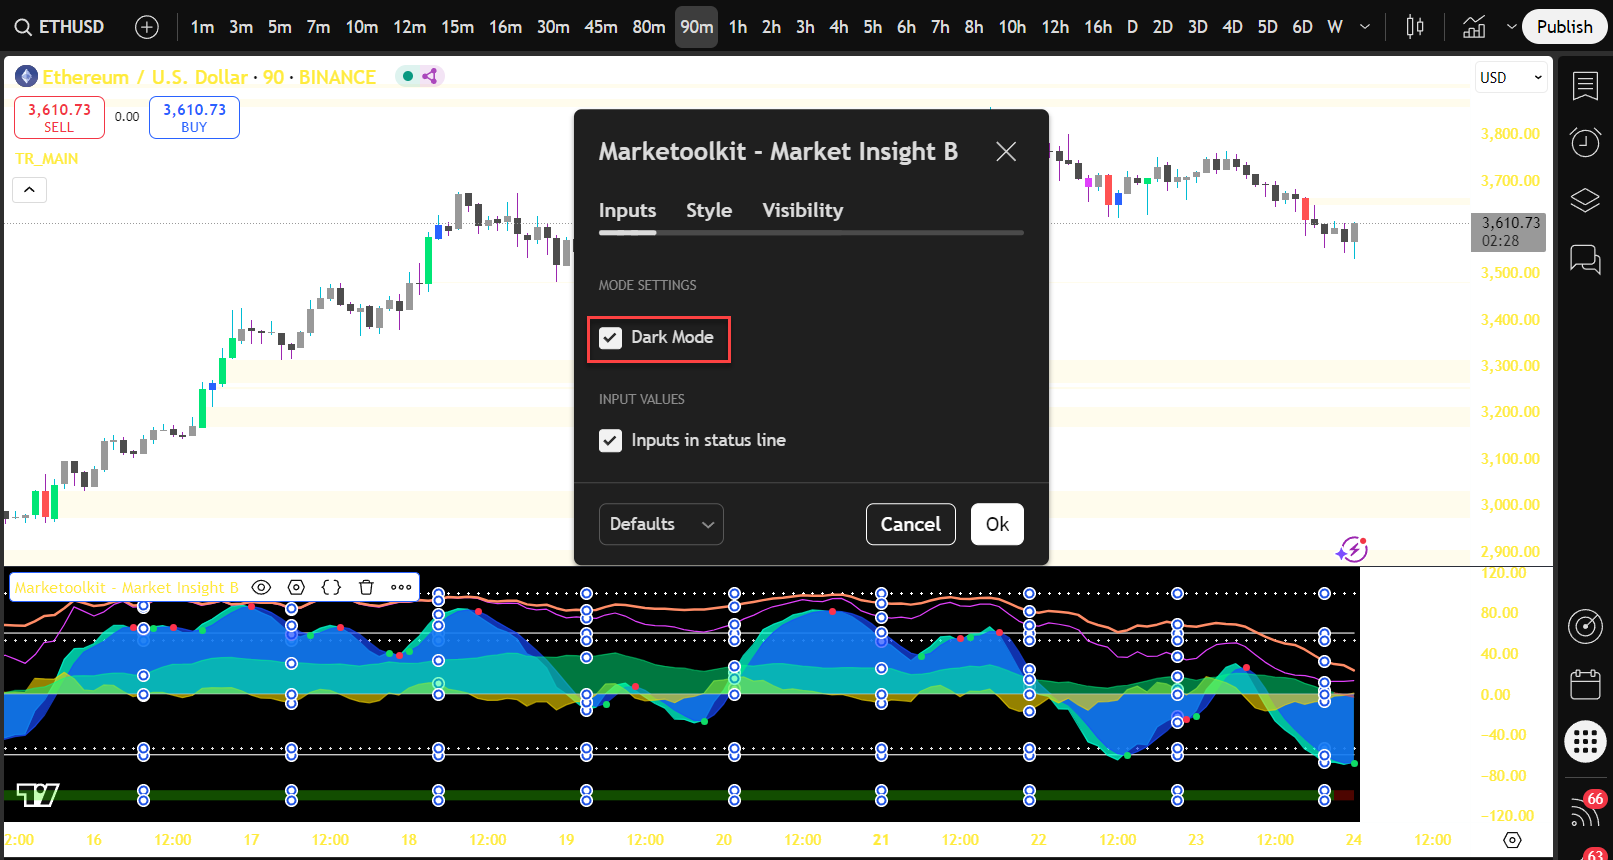
Marketoolkit – Market Insight B
Market Insight B is a multi-layered oscillator system designed to help you visualize momentum shifts, trend pressure and money flow dynamics using clean, color-coded visuals and symbolic signals.
⚠️ For educational and informational purposes only. This script is not financial advice or a signal service. Always perform your own analysis and use appropriate risk management.
How to Read Market Insight B
✅ Green Dot (Buy Dot):
Appears when the fast momentum wave crosses above the slow wave, often near oversold levels. This indicates a potential bullish momentum shift or wave reversal.
❌ Red Dot (Sell Dot):
Triggered when the fast wave crosses below the slow wave, typically from overbought zones. This may signal a bearish shift or trend exhaustion.
Indicator Components:
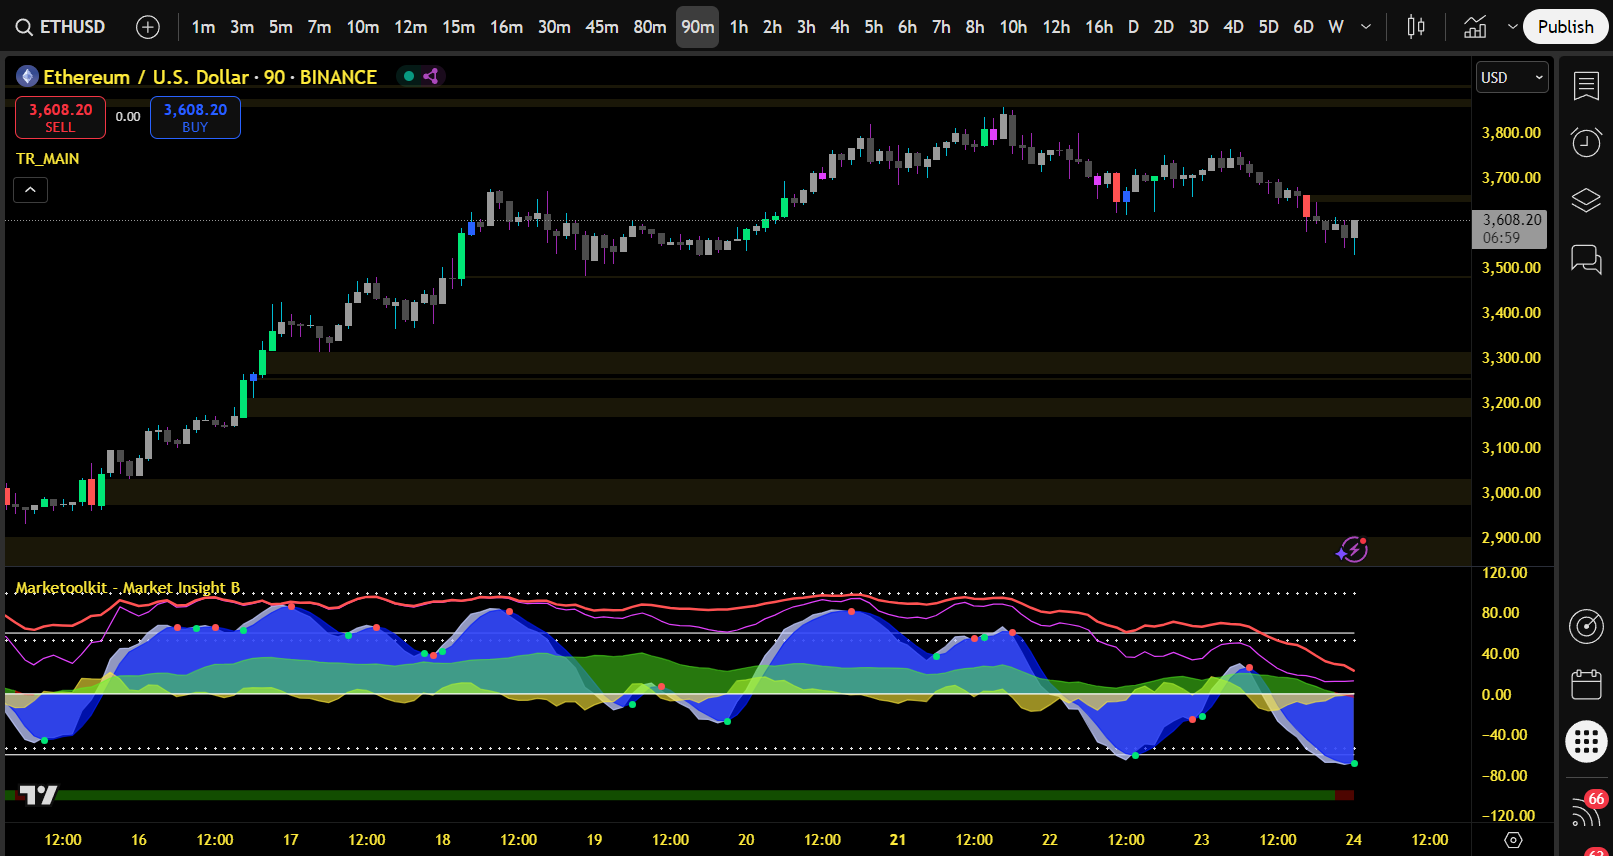
1. WaveTrend Oscillator (WT1 & WT2)
• The light blue area (WT1) and deep blue area (WT2) represent fast vs. slow momentum.
• Crossovers between them generate Buy/Sell Dots.
• Use the spacing between the waves to assess pressure buildup.
2. VWAP Line (Yellow Area)
• Shows the strength and continuation potential of the momentum wave.
• Above the zero line = bullish pressure; below = bearish pressure.
3. Money Flow Fill (Green/Red Area at Bottom)
• Highlights buying or selling volume pressure using a custom MFI formula.
• Green fill = inflow; Red fill = outflow.
• Plotted between levels -95 and -105 for clarity.
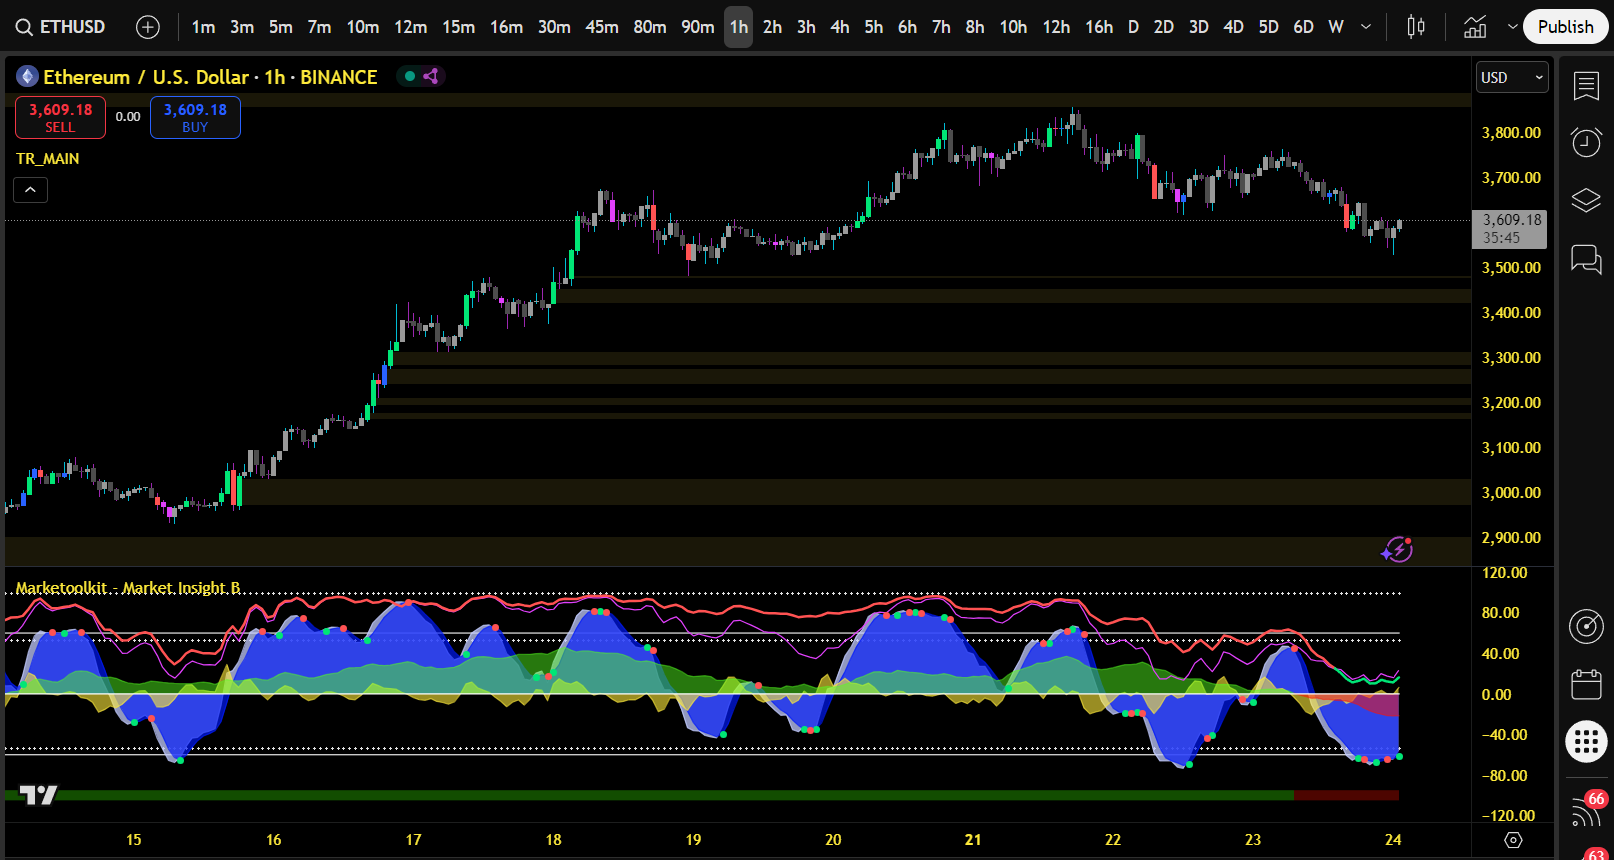
4. RSI and Stochastic Overlay
• Fuchsia line = RSI, smoothed using Heikin-Ashi data.
• Color-changing line = Stochastic:
o Green = Potential reversal (Stoch below RSI)
o Red = Bearish continuation (Stoch above RSI)
• Use crossover and separation between these lines to validate trade ideas.
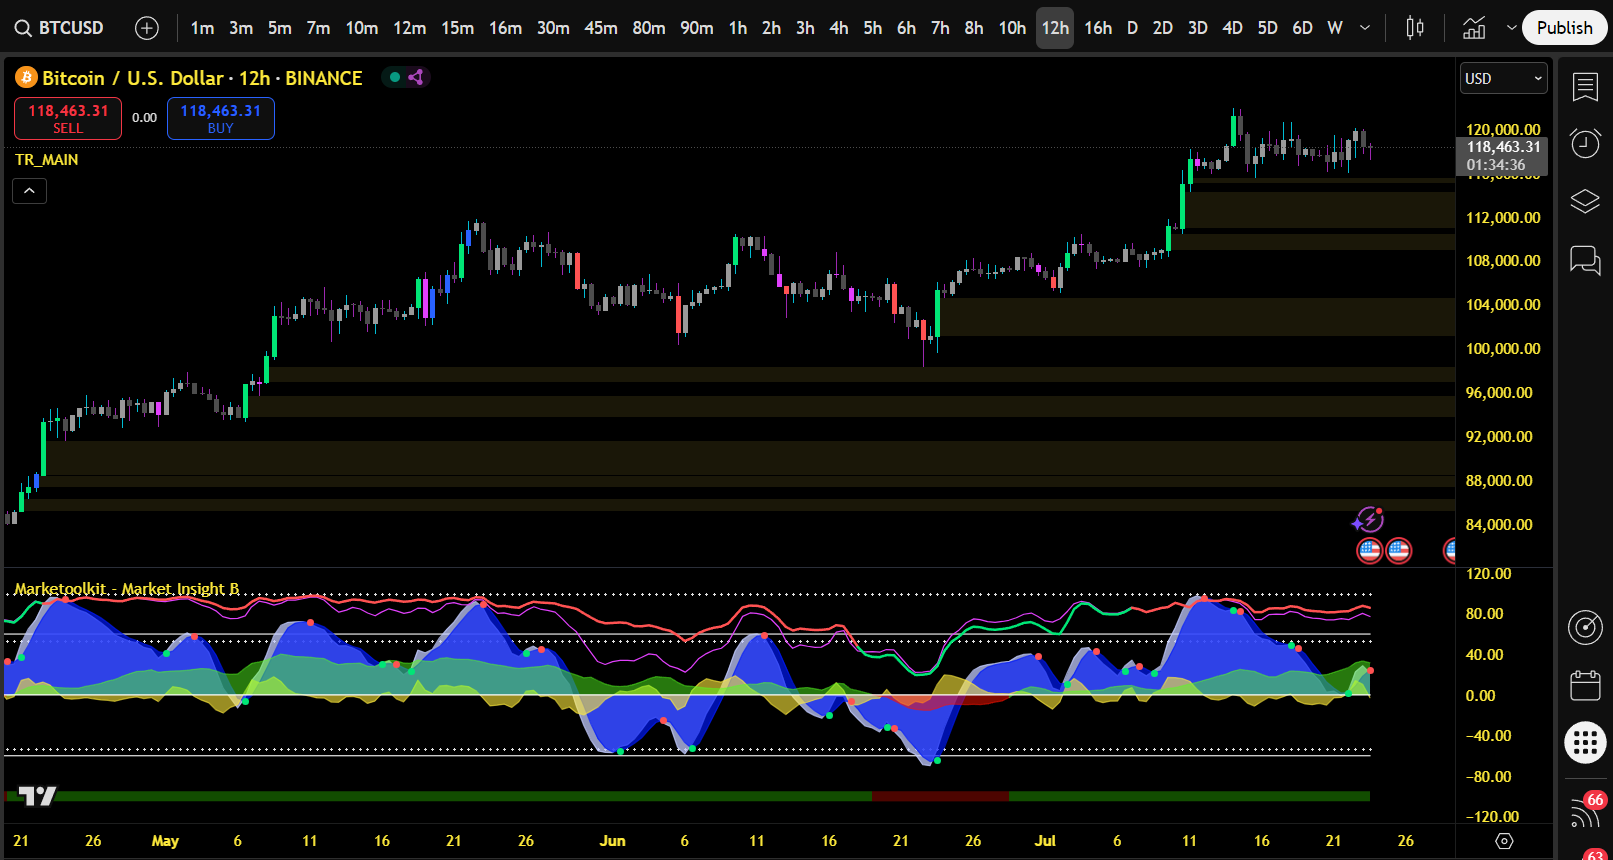
5. Key Reference Levels
• +60 / -60 → Overbought / Oversold Zones
• +53 / -53 → Trigger Zones (Momentum Crossover Sensitivity)
• 0 → Neutral Baseline
• 100 → Theoretical Maximum Wave Expansion
These levels help identify extreme conditions or strong continuation zones.
Tips for Usage (Educational Only)
• Look for Green Dot + MFI inflow + Bullish RSI/Stoch = Strong reversal potential.
• Combine Red Dot + MFI outflow + Overbought wave = Possible short setup.
• Use in conjunction with price action, support/resistance and higher timeframes for context.
• Not a standalone buy/sell signal—use it to build confluence and awareness of market dynamics.