Overview
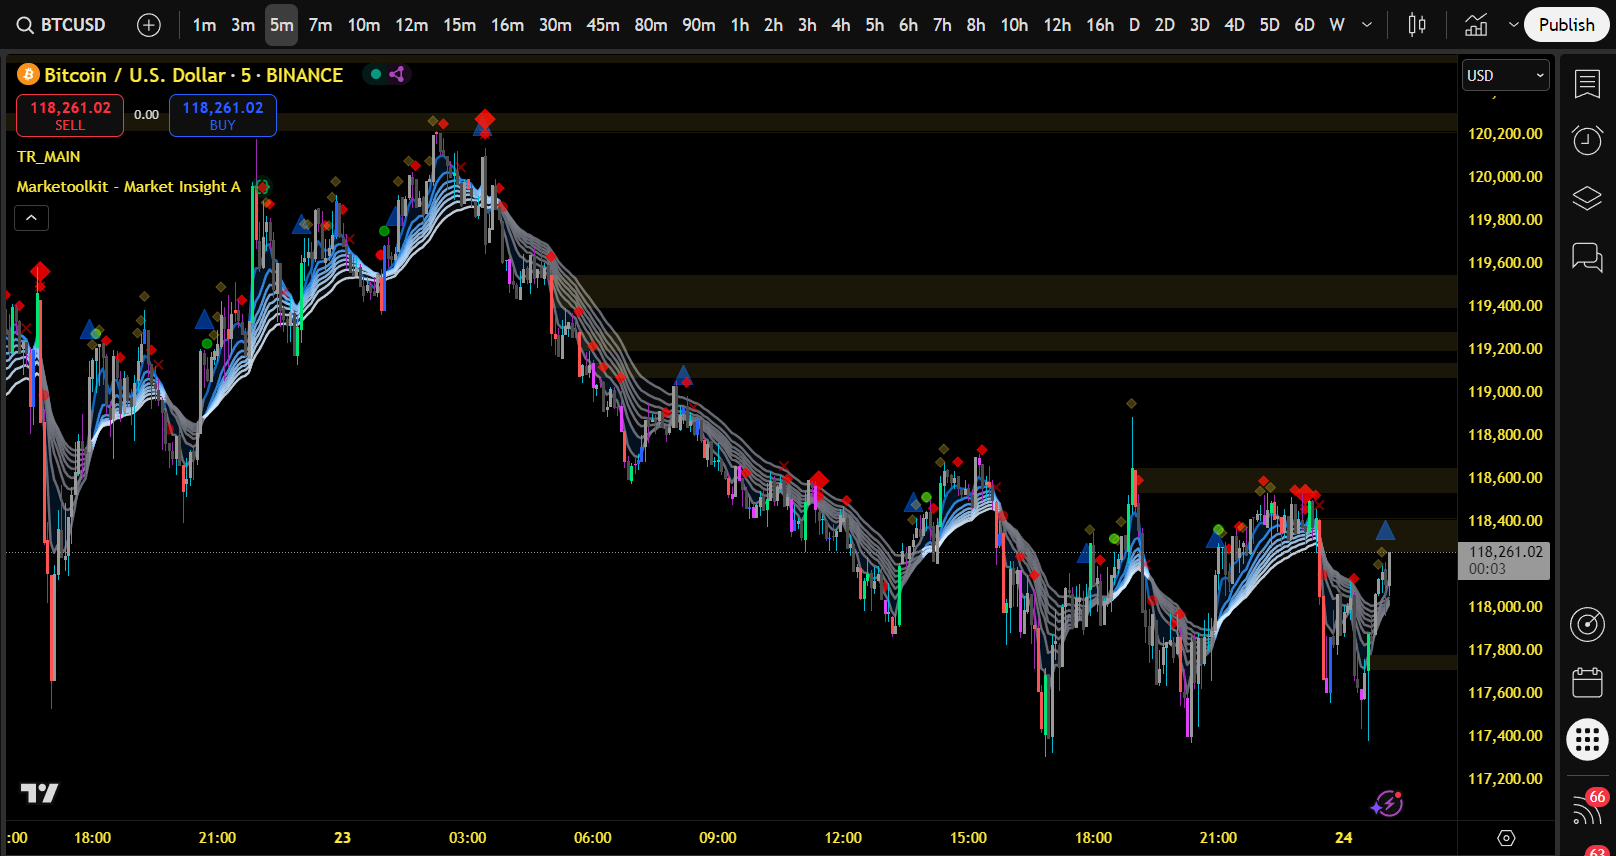
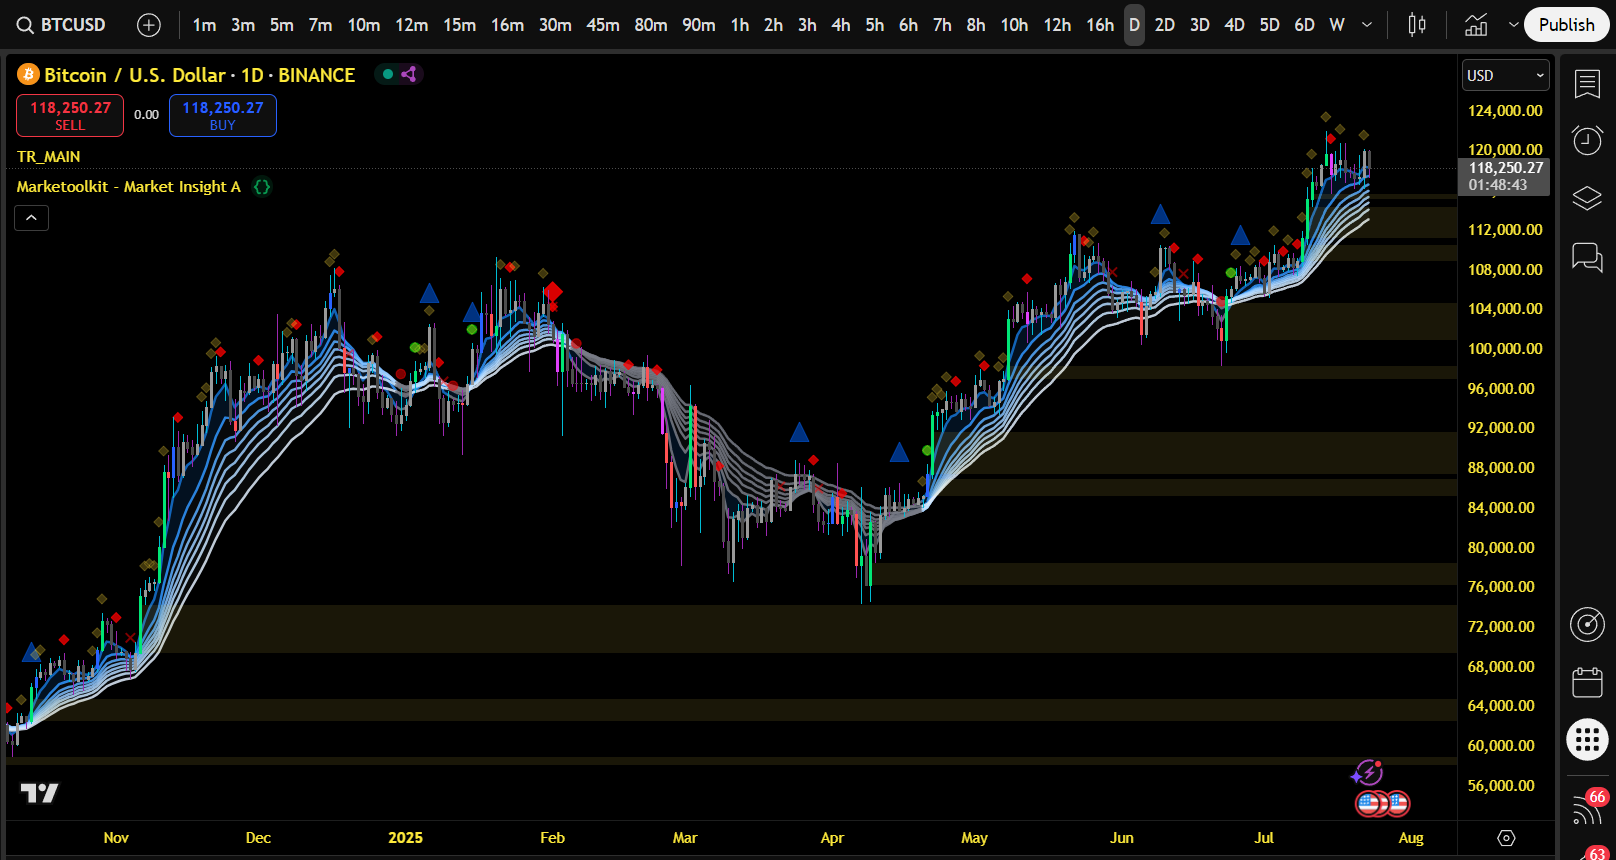
Market Insight A overlays your chart with a dynamic EMA ribbon and symbolic signals, helping you spot trend bias, momentum and potential reversal zones at a glance.
Marketoolkit - Market Insight A
Multi-Layered Trend & Momentum Signal System
Market Insight A is a high-performance visual overlay system designed to help users interpret trend, momentum and potential reversal zones using a curated set of symbolic signals and EMAs.
This script is ideal for helping users recognize behavior patterns in the market with intuitive iconography and clear ribbon structure.
System Components
8-EMA Ribbon:
• Dynamically colored ribbon for trend bias.
• Green-shaded ribbon = bullish bias (momentum compression for possible expansion).
• Red-shaded ribbon = bearish bias (momentum decay or exhaustion).
• Ribbon adapts visually using 8 EMAs with varied lengths (5–34) for macro/micro sensitivity.

Key Signals and How to Read Them

Best Practices
• Use ribbon direction and structure to determine overall market bias.
• Combine symbol triggers for higher confluence (e.g., Alpha Emerald + Sapphire Zenith).
• Watch for Ruby Vector or Golden Pivot X around key price levels for educational analysis of reversals or traps.
• Use alerts to monitor specific symbols of interest across your charts.
⚠️ Important Notice
This tool is provided for educational and informational purposes only. It is designed to assist in technical analysis learning and visual chart study.
It is not intended to be used as financial advice, a buy/sell signal, or any form of investment recommendation.
By using this indicator, you acknowledge that all actions you take are your own and you assume full responsibility for any decisions made.