Overview
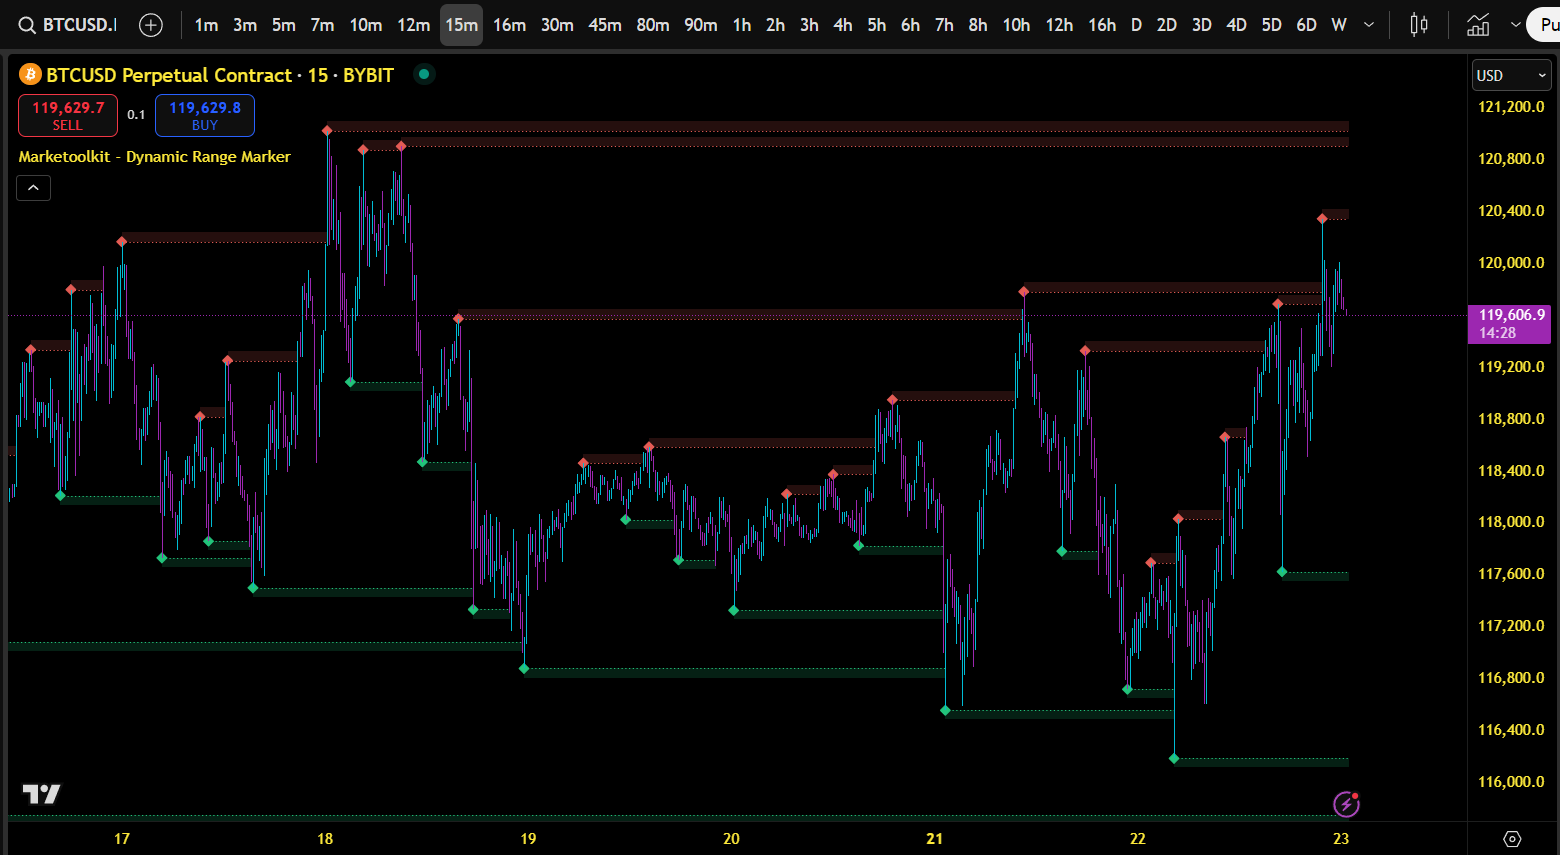
Dynamic Range Marker automatically detects and visualizes significant pivots, dynamic support/resistance zones and order flow shifts. Ideal for marking key levels and filtering noise in any market.
Dynamic Range Marker is an advanced price action utility for TradingView designed to automatically detect and visualize significant high and low pivots, dynamic support/resistance zones and order flow shifts - directly on your chart.
What Does It Do?
* Auto-Detects Key Price Levels: Identifies recent swing highs and lows using adjustable left/right bar lookbacks.
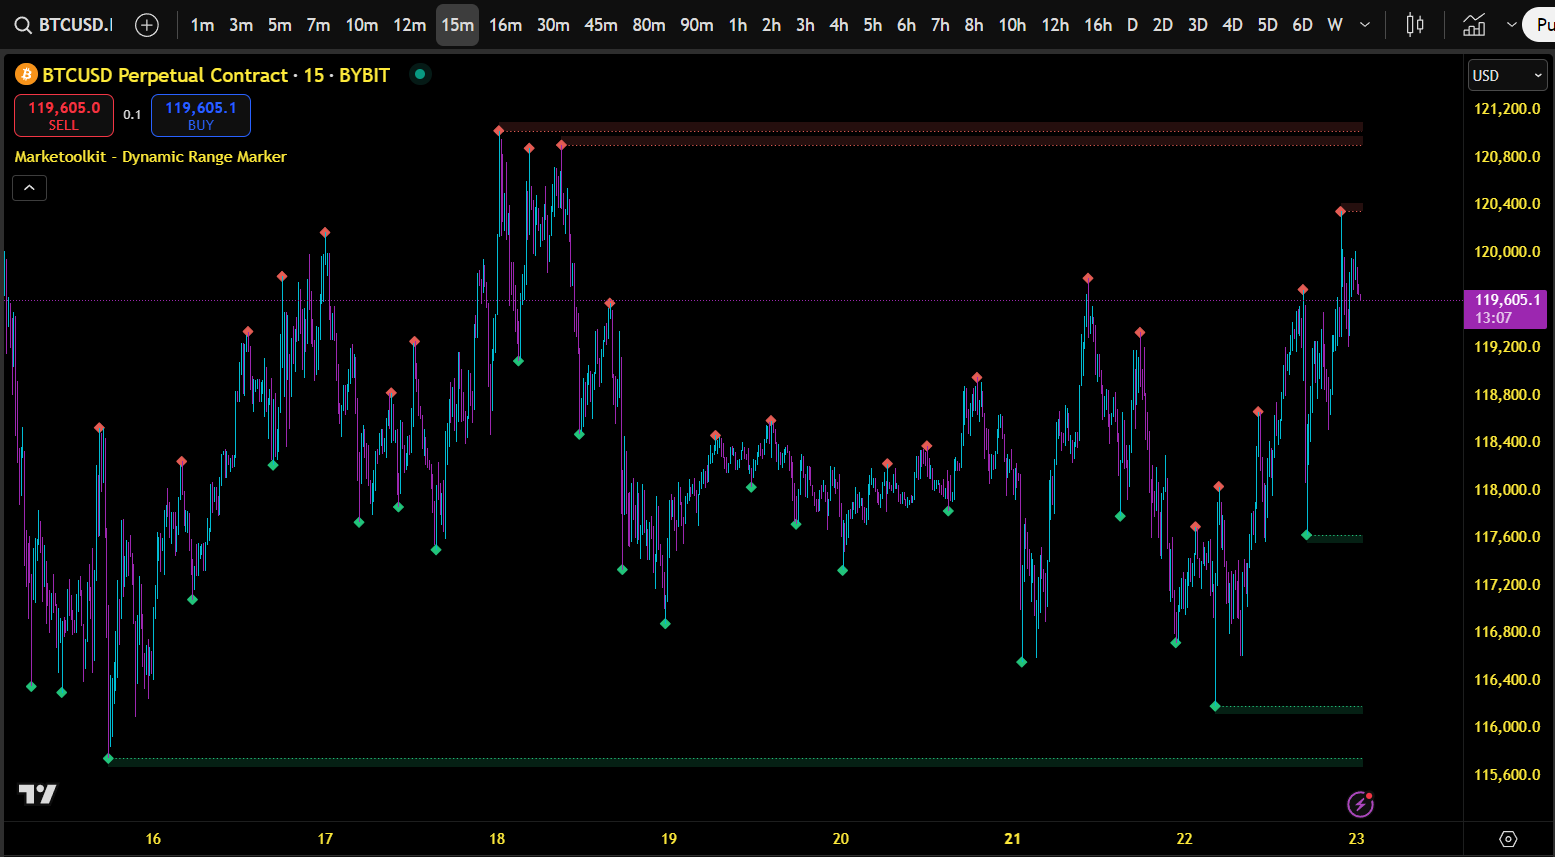
* Plots Dynamic Zones & Levels: Visualizes levels as zones (ranges) or clean lines, so you can see exactly where price historically reacted.
* Session-Aware & Filtered: Optionally filters plotted zones by volume, open interest (OI) delta and swing type, providing only the most relevant levels for your trading session or asset.
* Flexible Visualization: Toggle between drawing full zones, lines and marker symbols, with color and style customization for highs and lows.
* Smart Zone Management: Levels and zones automatically update, extend or disappear based on whether price has interacted with them - keeping your chart clear and focused.
* Order Flow Integration: Optionally filter for zones that meet minimum volume or open interest change, helping you focus on areas of strong activity.
* Cross-Exchange Data: Integrates order flow from major exchanges (Binance, BitMEX, Kraken) to improve accuracy in both crypto and traditional markets.
How It Works
* Pivot Detection: The script continuously scans for local price pivots (swing highs/lows) using your specified lookback windows.
* Zone Plotting: When a new significant high or low is detected, the indicator draws a horizontal zone (or level) from that bar forward, optionally extending it until it’s touched by price.
* Dynamic Cleanup: Zones/levels are automatically removed, extended or hidden depending on user settings and whether they are “touched” (price trades through them).
* Order Flow Filtering: You can require a minimum volume or OI delta for a swing to be considered valid - ideal for filtering out noise and focusing on meaningful ranges.
* Visualization Options: Full control over colors, zone width, marker type/size, text alignment and display for a fully tailored visual experience.
Ideal For
1. Marking dynamic support/resistance zones
2. Identifying supply/demand imbalances
3. Filtering only significant levels using real order flow metrics
4. Any price action, range or order flow-based trading strategies
How to Use:
1. Add the indicator to your chart.
2. Adjust the “Lookback Bars Left/Right” and style settings to suit your timeframe and visual preferences.
3. Enable volume or open interest filters to see only the most significant ranges.
4. Watch for newly plotted highs/lows—these highlight dynamic, market-driven support and resistance.
⚠️For educational and informational purposes only. Not financial advice.